DataFrame Table
Overview
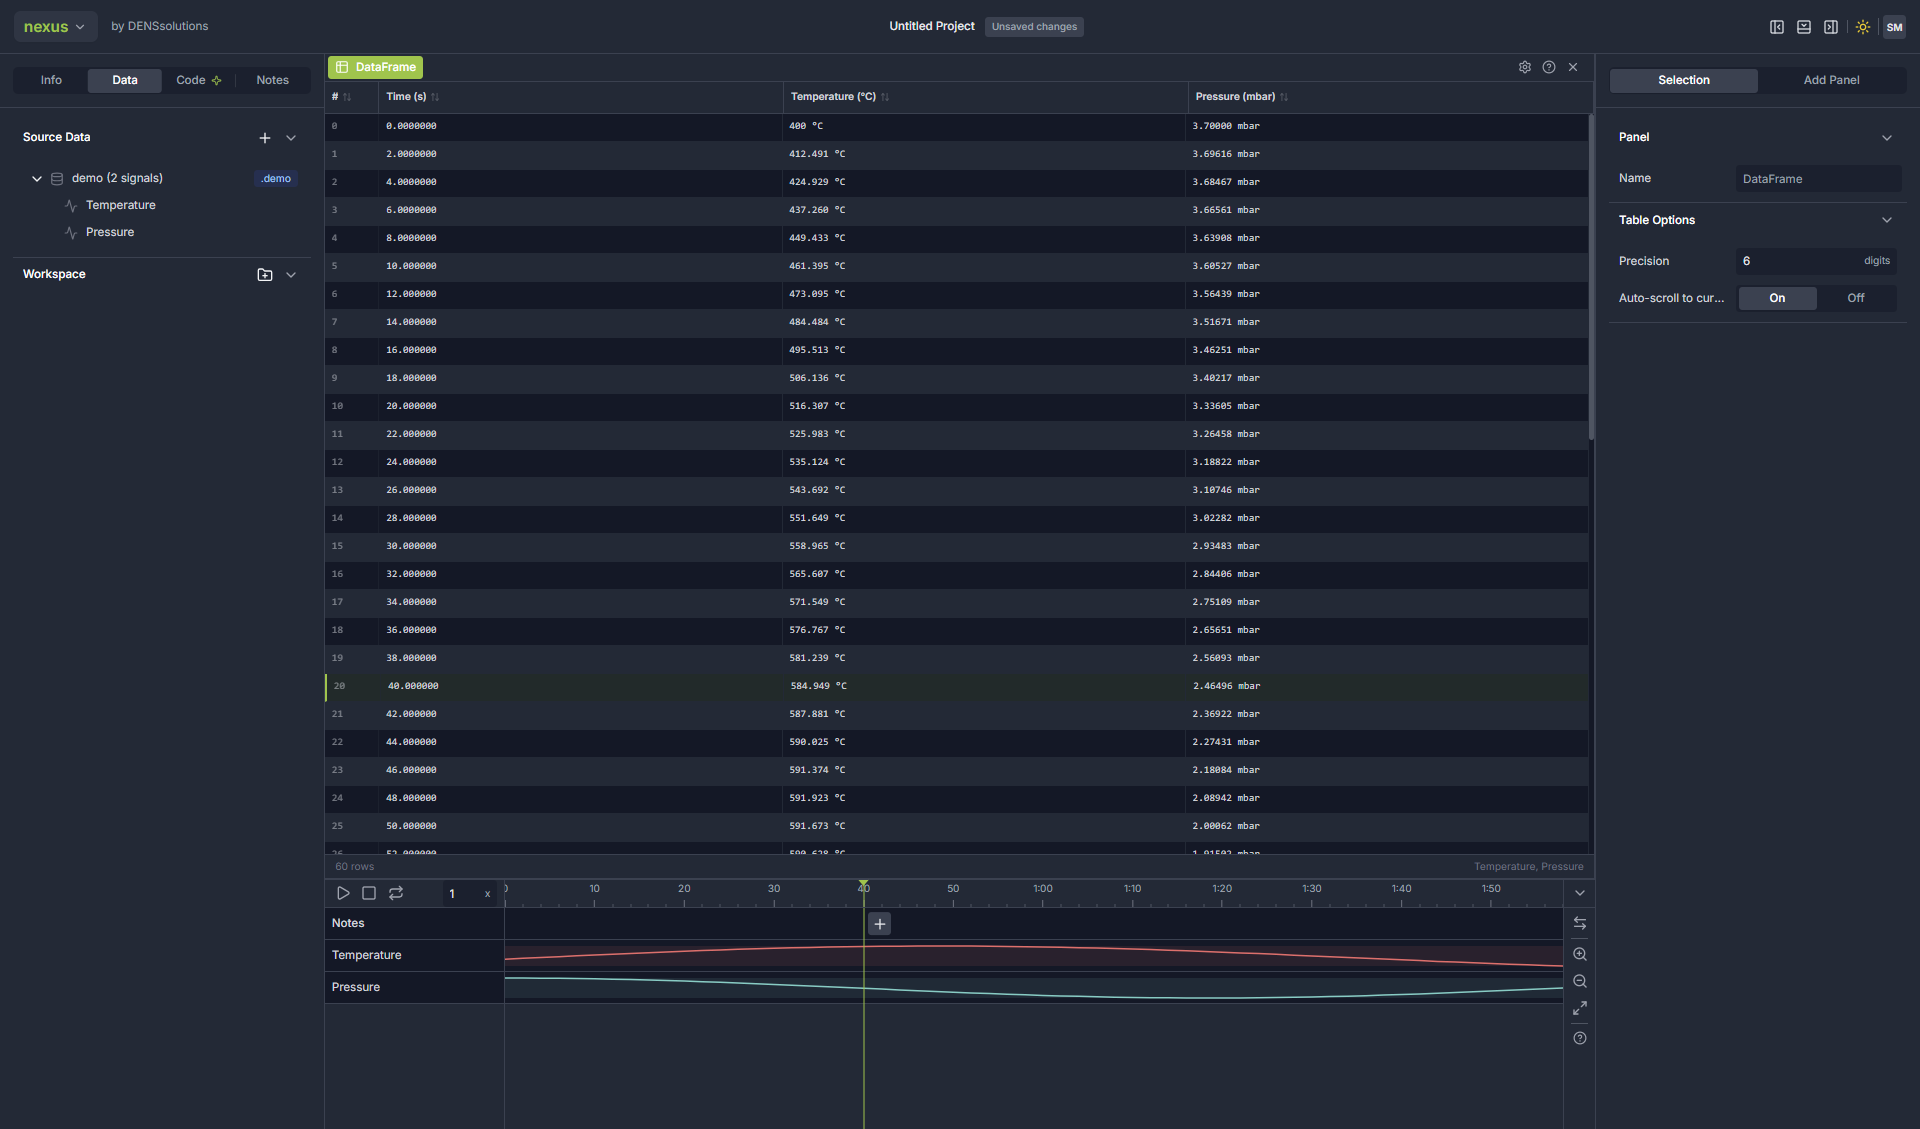
A DataFrame panel shows scalar (0Dts) signals as a table of values. Columns are the panel’s signals, rows are timepoints, and the row at the current timeline time is highlighted. Use it when you want to read exact numbers off your data - checking a value at a specific moment, comparing several signals side by side, or scanning for outliers - rather than the trends a Time Series Graph is better at showing.
Creating a DataFrame Panel
There are two ways to open a table.
- Add Panel menu: open the Add Panel tab in the right sidebar and drag the DataFrame button (Table icon) onto the canvas. The panel is created empty - drop a 0Dts signal into it afterwards.
- From a signal: dragging a 0Dts signal onto empty canvas creates a Time Series Graph by default. To view the same signal as a table, create a DataFrame panel from the Add Panel menu first, then drop the signal into it.
The DataFrame panel accepts only 0Dts (scalar time-series) signals. Spectrum (1Dts) and image (2D / 2Dts) signals are not compatible.
Columns
Every table has two fixed columns followed by one column per signal:
| Column | Contents |
|---|---|
| # | The row’s index in the source data. |
| Time | The timepoint for that row. Signals recorded in absolute time show a wall-clock time (HH:MM:SS.mmm); otherwise the raw time value is shown. |
| Signal columns | One column per signal, headed with the signal name and its unit - e.g. Temperature (°C). Each cell shows the value with its unit appended. Missing values read as —. |
All signals in the panel share the time axis of the first signal added.
Sorting
Click any column header to sort the table by that column. Click the same header again to reverse the direction; an arrow in the header shows the current sort. Sorting does not change which row is highlighted for the current time - only the order rows are displayed in.
Adding and Removing Signals
- Add a column: drop another 0Dts signal onto the panel. It is appended as a new column.
- Remove a column: hover over a column header and click the × that appears. (The control is only shown when more than one signal is present.)
The footer shows the total row count and the names of the signals currently in the table.
Timeline Interaction
The DataFrame stays in sync with the global timeline:
- Highlight: the row matching the current timeline time is highlighted with a green marker.
- Click to seek: click any row to move the timeline cursor to that row’s timepoint. Every other panel updates to match.
- Auto-scroll: during scrubbing or playback the table scrolls automatically to keep the highlighted row in view. Clicking a row does not scroll the table, so the row you clicked stays under the cursor.
Large tables are virtualized, so scrolling stays smooth even with many thousands of rows.
Table Options
Select a DataFrame panel to reveal its settings in the right sidebar, under Table Options:
| Setting | Description |
|---|---|
| Precision | Number of significant digits used to format values (1-15, default 6). |
| Auto-scroll to current row | Toggles whether the table follows the highlighted row during scrub and playback. |